Articles
This time it’s different
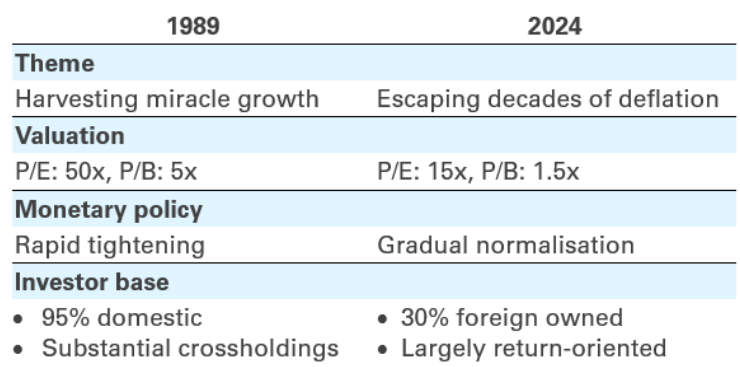
On 22 February 2024, the Nikkei Average recorded an all-time high of 39098.68, 34 years on from its previous peak of 38915.87 on the last trading day of 1989. History does not repeat itself, it has been said, but it often rhymes: stock market growth in 1989 was supported by easy monetary conditions, as is the current rise. Here, the rhyming ends, however. Valuations tell an entirely different story; significant shifts in the investor base have had a marked impact; and the Bank of Japan is following a distinctly different roadmap.
Valuations
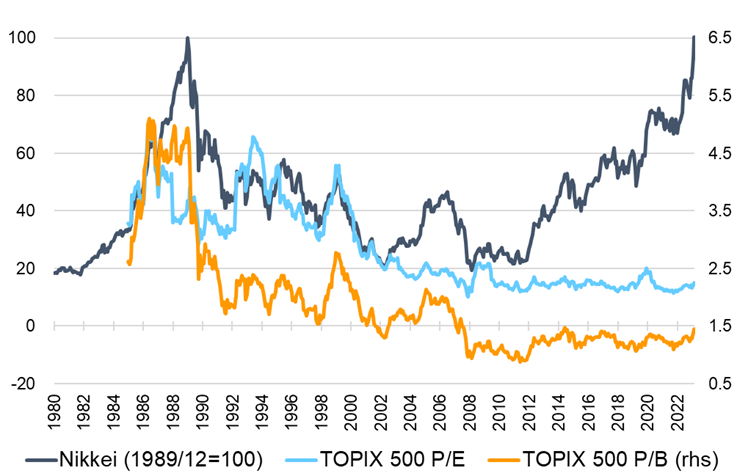
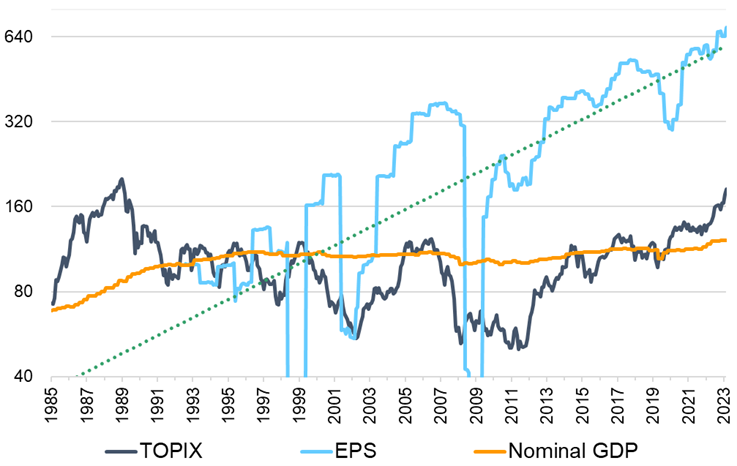
The market’s P/E ratio today is around 15x, compared to a staggering 50x in 1989; P/B is down from 5.0 in 1989 to 1.5. EPS of listed companies has grown at an average pace of around 6.5% p.a. over the past 30 years, much faster than the country’s GDP. This time it’s different: the all-time high stock price is backed by all-time high corporate earnings.
Investor base
The pace of Nikkei appreciation is, however, faster than the EPS growth. P/E expansion now is driven by expectations for a Japanese economy finally escaping decades of deflation. This prospect, combined with concerns about China, appears to be driving overseas investors to increase allocations to Japan – buying JPY 1.8 trillion in Japanese equities in the first month and a half of 2024, in addition to JPY 6.3 trillion in 2023.
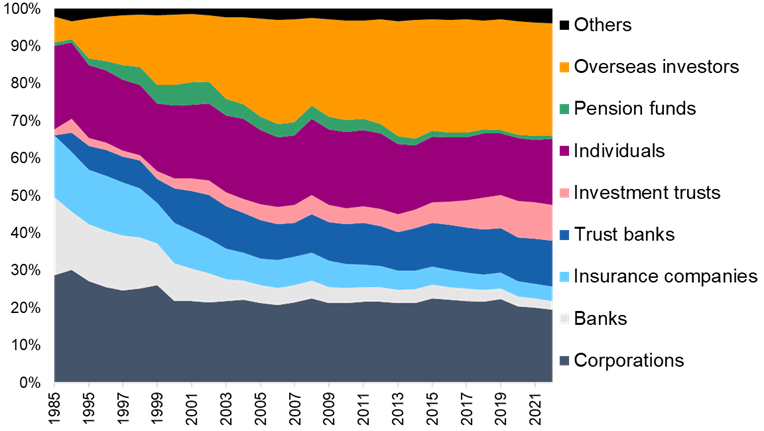
Japan’s financial bubble at the end of the 1980s was driven by a feeling that the market was enjoying the harvest of its post-war economic miracle. Asset prices were inflated to a level that the square kilometre on which stands the Imperial Palace in Tokyo was held to be worth more than the US state of California. This was an overwhelmingly domestic bubble, with foreign ownership around just 5% in 1989; overseas investors now hold more than 30% of Japanese equities. Stock prices were inflated by limited supply, as some 40% of shares were held by stable, silent shareholders, with around half estimated to consist of cross-shareholdings – equity held by companies in business partners for the strategic purpose of maintaining those relationships. Financial sectors, including banks and insurance companies, accounted for more than 30% of market capitalisation in 1989, but partly due to the liquidation of cross-shareholding their market weight has been more than halved.
Monetary policy
1989’s peak prompted the Bank of Japan to start a rapid tightening to kill the asset bubble, raising the policy rate from 3.75% in December 1989 to 6% eight months later. Again, this time it’s different: all evidence points to the bank normalising only gradually, with money market rates implying an end to negative rates in April, and a further 25bps at most in the following eight months to year end.
Semiconductor names drive surge
The Nikkei has risen 5634.51 points or 16.8% this year, outpacing other indices like TOPIX (12.4%) and MSCI Japan (13.7%). Nikkei being a price weighted index, higher adjusted price constituents have higher weights in the index and indeed the top five names contributed more than half of the year-to-date appreciation. Three names in particular account for almost 40% of year-to-date performance, with Tokyo Electron (8035), Advantest (6857), and SoftBank Group (9984) rising 44.8%, 47.8% and 39.8% respectively. These three, nicknamed the “Nvidia Brothers” – the first two being semiconductor manufacturing equipment manufacturers and the third the holder of UK chip designing giant Arm – represent recent positive movements in the semiconductor industry, echoing the “Magnificent Seven” driving the US market.
This time it’s different
Japanese stocks are climbing fast in 1989, but this is no repeat of the 1989 bubble. Valuations, the macro and monetary environment, and a very different investor base all point to reasonable justification, not irrational exuberance; while we will continue to monitor developments, we maintain a bullish outlook over the medium term.
About the author
 |
Hiro Kasai, Senior Strategist
A founding figure in TMAM’s investment process, with three and a half decades’ experience in asset management, including spells as CIO of TMAM and CEO of its New York subsidiary, as well as head of Asian investment for the Tokio Marine Group. When not providing macroeconomic and market insights, Hiro enjoys onsen trips and countryside walks. |
Disclaimer
The information contained in this document is intended solely for the purposes of information only and is not intended as an offer or solicitation by anyone in any jurisdiction in which such an offer or solicitation is not authorized or to any person to whom it is unlawful to make such an offer or solicitation. This report has not been reviewed by the Monetary Authority of Singapore.